Live Data viewer
Your Uberlogger is set to display all live data from your channel inputs by default. If any NTCs are enabled, the temperature will be shown in degrees Celsius. You can also see live values during logging. Refresh rates are always limited to 1 Hz.
When logging data and having a sample frequency of 1, 2 or 5 Hz, it may take up to 70 seconds before data is shown in the live data viewer.
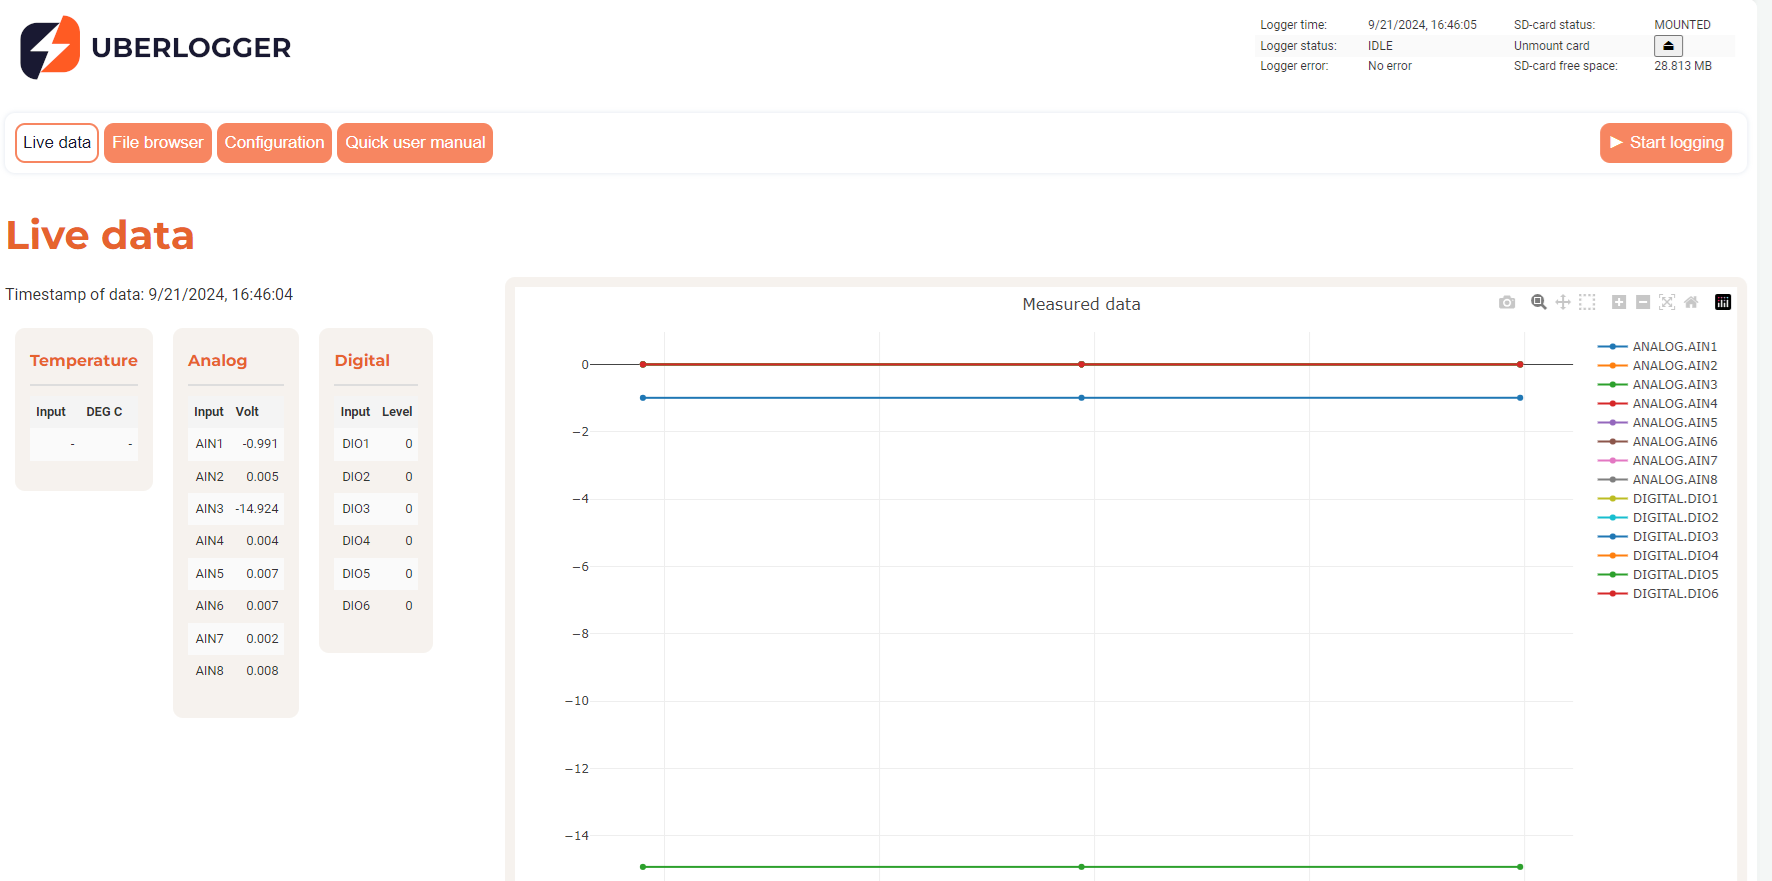
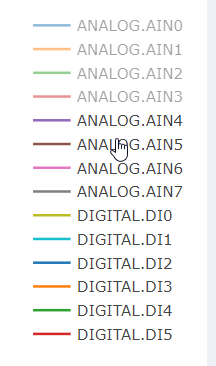
On the Live data tab you can see the current data measured by the Uberlogger. On the right the legend of the channels is shown. To show or hide signals, click on the signals in the legend to toggle them on or off.
From firmware v1.3.3 on, channels you have labelled in the
Configuration are shown by their label
(for example Inlet (T1)) in both the legend and the value list. Hover a
signal on the chart to read its exact value at the cursor; crosshair lines
mark the corresponding time and value on the axes.
When you hover over the chart, you see a variety of icons popping up on the right.
![]()
You can zoom and move around the chart as described next.
Zooming
Box zoom: Click and drag on the plot to draw a rectangle around the area
you want to zoom into the data. You can also click the
![]() button on the right corner when hovering over the chart and perform the same action. Zoom In & Out Buttons: On the top-right corner of the plot, you'll find zoom in and zoom out buttons
button on the right corner when hovering over the chart and perform the same action. Zoom In & Out Buttons: On the top-right corner of the plot, you'll find zoom in and zoom out buttons
![]() that will zoom in or out incrementally.
that will zoom in or out incrementally.
Panning/Scrolling
Drag: Click the pan
![]() button and drag the plot in any direction
to pan through the data. You can also click and hold on the x- or y-axis
and move to the left, right, top or bottom to pan to the direction you
want.
button and drag the plot in any direction
to pan through the data. You can also click and hold on the x- or y-axis
and move to the left, right, top or bottom to pan to the direction you
want.
Reset axis
If you've zoomed in or scrolled and want to get back to the original
view, use the "Reset Axes" button
![]() , located in the top-right corner of the plot. If you double-click anywhere in the main plotting area, it will reset
the plot to its original view (like the "Reset Axes" button
, located in the top-right corner of the plot. If you double-click anywhere in the main plotting area, it will reset
the plot to its original view (like the "Reset Axes" button ![]() ). If you
double-click on an axis, it will auto-scale just that axis.
). If you
double-click on an axis, it will auto-scale just that axis.
Snapshot Button
Clicking the camera icon
![]() will allow you to take a snapshot of
your current plot view and download it as a PNG image.
will allow you to take a snapshot of
your current plot view and download it as a PNG image.
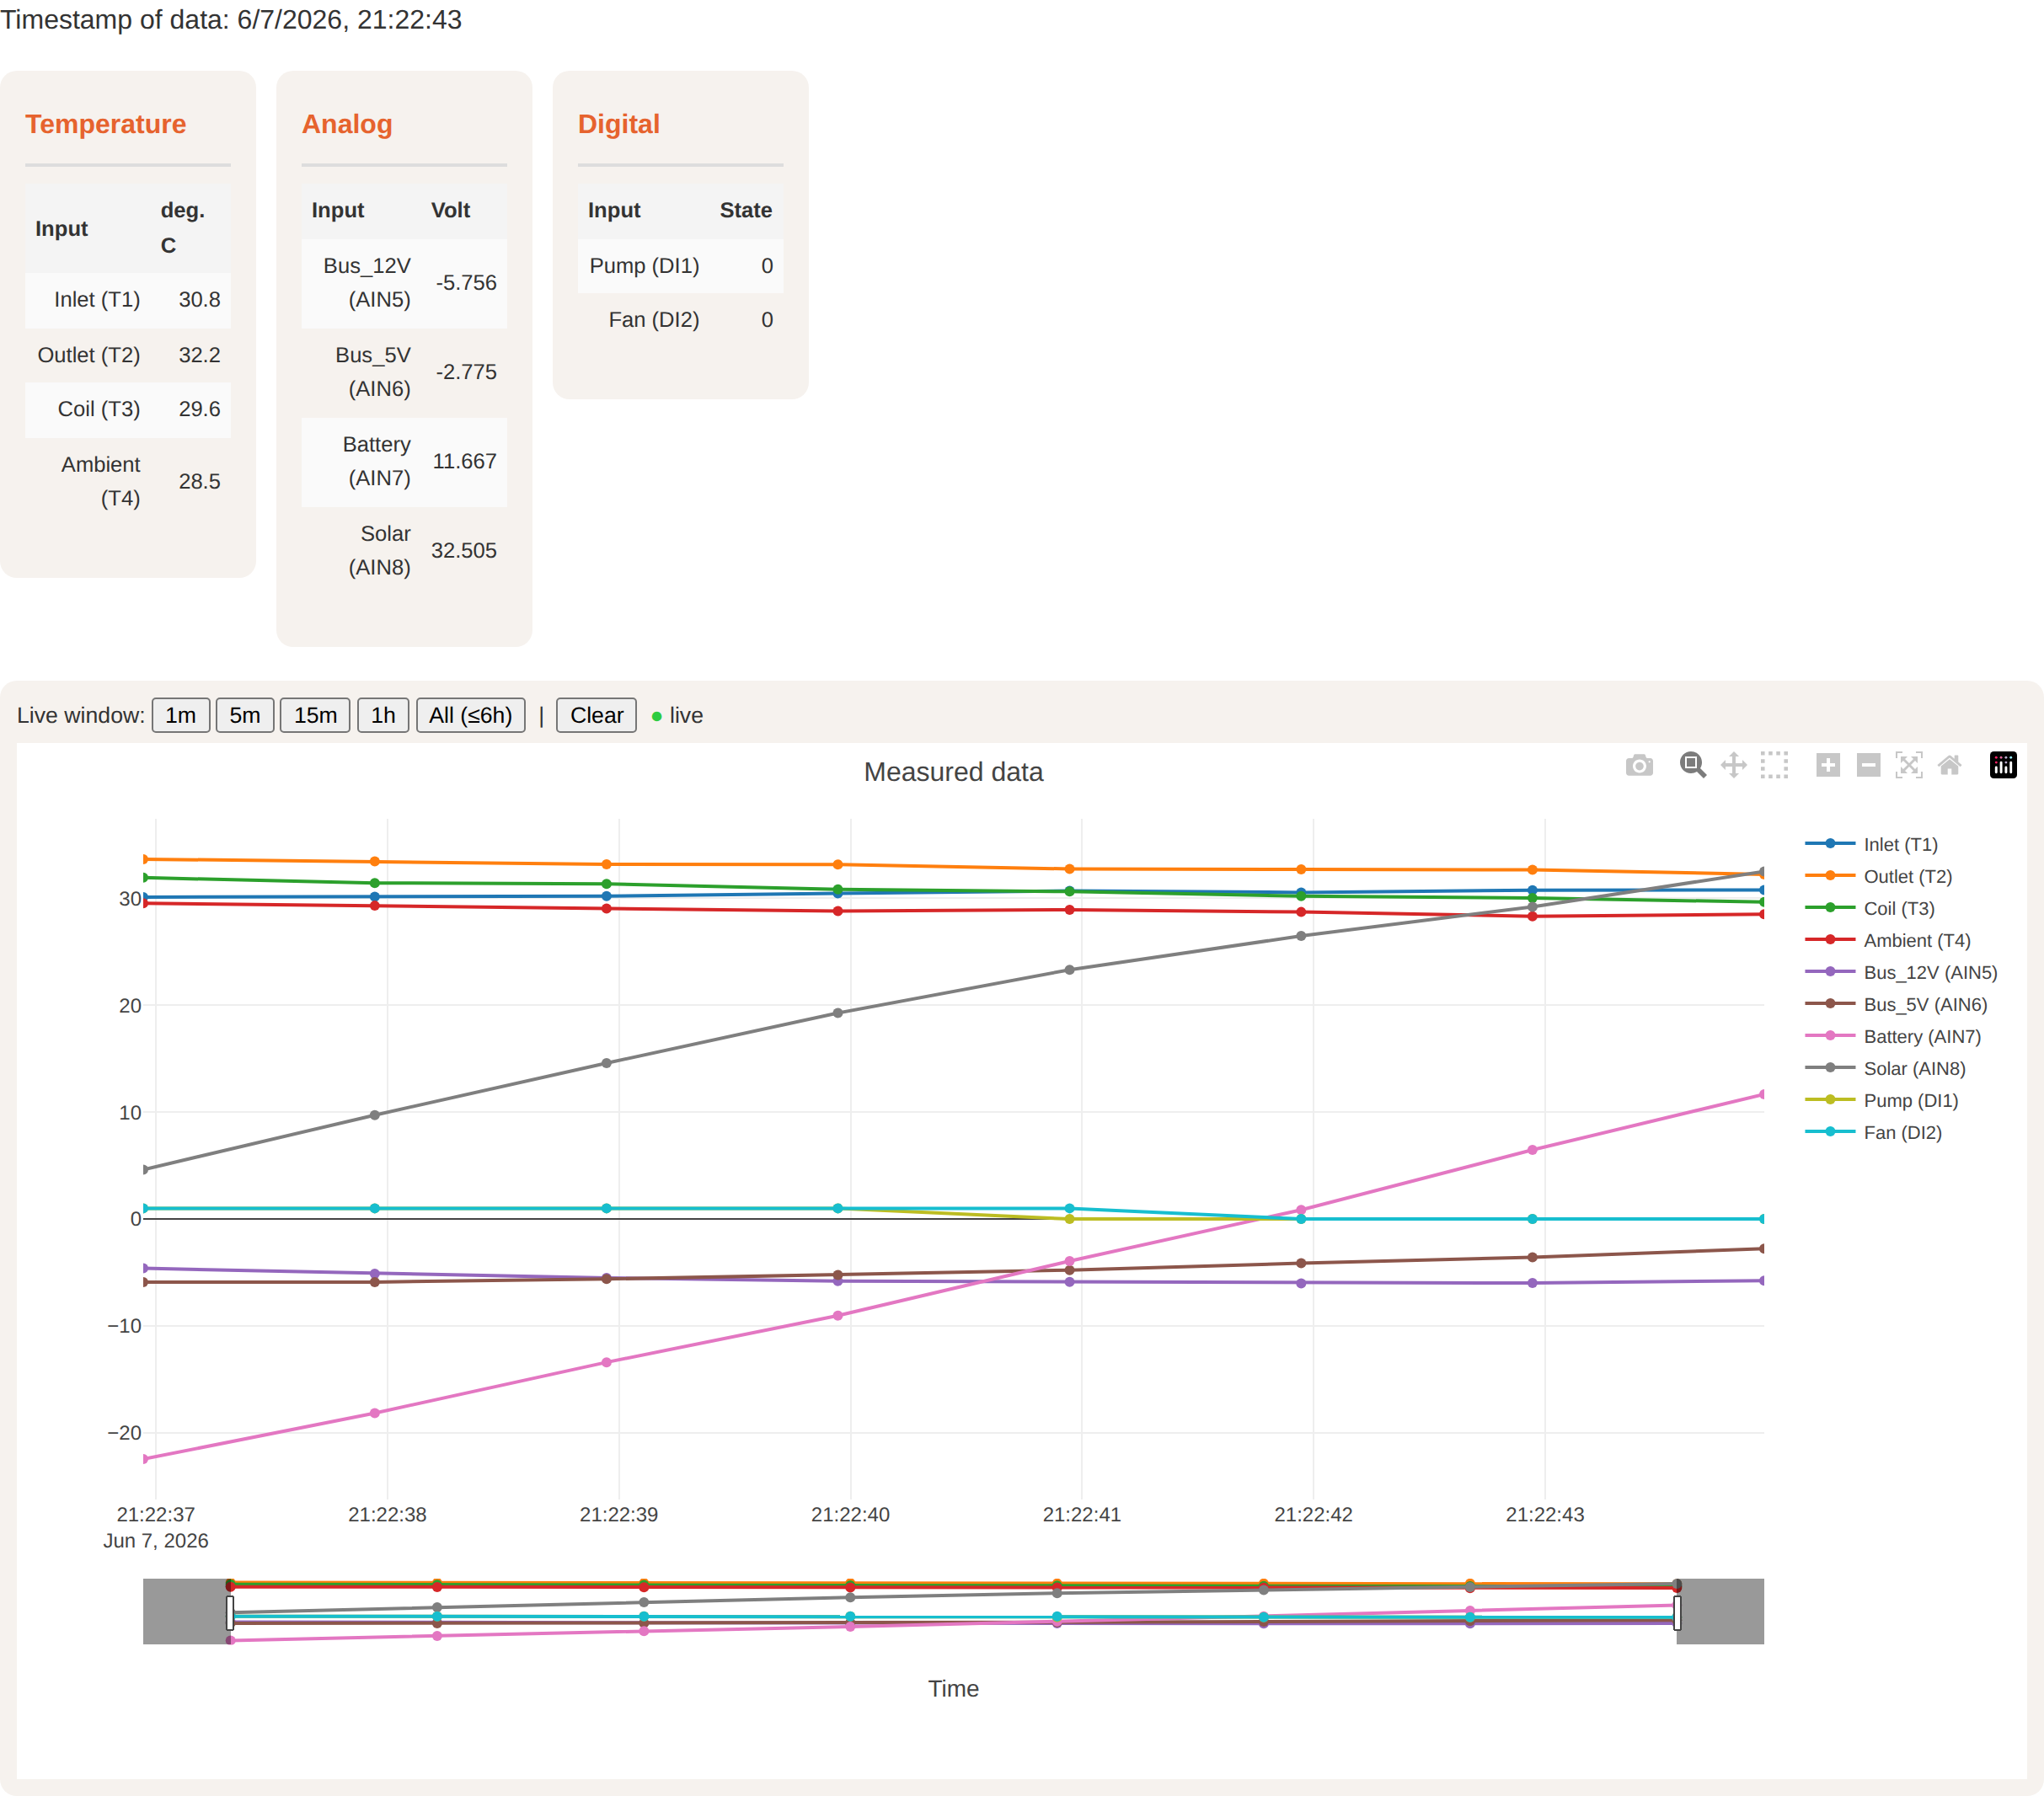
Live time window

From firmware v1.3.2 on, a row of buttons above the chart (1m / 5m / 15m / 1h / All) sets how much recent history is shown. The chart follows the newest data ("live"); zooming or panning pauses following, and double-clicking the plot (or picking a window) resumes it. A small indicator next to the buttons shows whether the chart is live or paused. "All" shows the full retained history, up to a maximum of about 6 hours.
Data history
The live chart keeps roughly the last 6 hours of data per channel. This history is stored in your browser, so it survives a page refresh and keeps accumulating even while you are on other tabs (File browser, Configuration, etc.) — you no longer lose the chart by navigating away or reloading.
Clearing the chart
Use the Clear button above the chart to empty the stored history and start the live view from scratch. New samples begin filling the chart again immediately.
Connection indicator
The status dot next to the time-window buttons reflects the live connection to the Uberlogger: it is green while data is being received and turns red ("connection lost") if the browser can no longer reach the device.